nvBench 2.0: A Benchmark for Natural Language to Visualization under Ambiguity

1The Hong Kong University of Science and Technology (Guangzhou), 2The Hong Kong University of Science and Technology

Abstract

Natural Language to Visualization (NL2VIS) enables users to create visualizations from natural language queries, making data insights more accessible. However, NL2VIS faces challenges in interpreting ambiguous queries, as users often express their visualization needs in imprecise language.

To address this challenge, we introduce nvBench 2.0, a new benchmark designed to evaluate NL2VIS systems in scenarios involving ambiguous queries. nvBench 2.0 includes 7,878 natural language queries and 24,076 corresponding visualizations, derived from 780 tables across 153 domains. It is built using a controlled ambiguity-injection pipeline that generates ambiguous queries through a reverse-generation workflow. By starting with unambiguous seed visualizations and selectively injecting ambiguities, the pipeline yields multiple valid interpretations for each query, with each ambiguous query traceable to its corresponding visualization through step-wise reasoning paths.

We evaluate various Large Language Models (LLMs) on their ability to perform ambiguous NL2VIS tasks using nvBench 2.0. We also propose Step-NL2VIS, an LLM-based model trained on nvBench 2.0, which enhances performance in ambiguous scenarios through step-wise preference optimization. Our results show that Step-NL2VIS outperforms all baselines, setting a new state-of-the-art for ambiguous NL2VIS tasks.

Example of reasoning appropriate visualizations from an ambiguous natural language query

Step-wise Disambiguation

When resolving ambiguities in natural language queries, we employ a step-wise reasoning approach that mimics human decision-making processes. This approach involves:

  1. Data Selection Reasoning: Identifying relevant data columns and filters from the query
  2. Chart Type Reasoning: Determining appropriate visualization types based on analytical tasks
  3. Channel Mapping Reasoning: Assigning data elements to visual channels
  4. Data Transformation Reasoning: Specifying operations like aggregation or filtering
  5. Visualization Synthesis: Generating complete visualizations that represent valid interpretations

This structured approach enables systematic resolution of ambiguities while preserving multiple valid interpretations of the original query.

Figure 1: Example of reasoning appropriate visualizations from an ambiguous natural language query

As shown in Figure 1, a seemingly straightforward query like "Show the gross trend of comedy and action movies by year" contains multiple ambiguities: "gross" could refer to either World_Gross or Local_Gross columns, "Comedy and action" implicitly requires filtering by Genre, "trend" may suggest a bar chart or line chart, and "By year" implies temporal binning that isn't explicitly defined. The figure illustrates how these ambiguities can be resolved through step-wise reasoning to produce multiple valid visualizations.

Ambiguity-Injected NL2VIS Data Synthesizer

We developed a data synthesizer that systematically introduces ambiguity into seed visualizations. This approach ensures control over the types of ambiguity while maintaining meaningful, interpretable outputs.

An overview of ambiguity-injected NL2VIS data synthesizer

Figure 2: An overview of ambiguity-injected NL2VIS data synthesizer.

We developed an ambiguity-injected NL2VIS data synthesizer that systematically introduces controlled ambiguity into visualization specifications. As shown in Figure 2, our pipeline consists of: (a) Ambiguity-aware VIS Tree Synthesis that begins with seed visualizations and injects ambiguity nodes to create ambiguity-aware visualization trees, (b) VIS Synthesis that uses an ASP solver to resolve these trees into multiple valid visualizations, (c) NL Synthesis that generates ambiguous natural language queries corresponding to the multiple valid visualizations, and (d) Reasoning Path Synthesis that produces step-wise reasoning paths documenting how ambiguities are resolved.

Injecting ambiguities into a seed visualization

Ambiguity Injection Process

Our ambiguity-injection process transforms seed visualizations into ambiguity-aware visualization trees. By selectively introducing ambiguity nodes, we create multiple valid interpretations of the same query.

As shown in the figure, we start with a seed chart and convert it to a visualization tree. Then, we inject ambiguities to create multiple possible interpretations. This ambiguity-aware tree can then be resolved in various ways, producing different valid visualizations for the same ambiguous query.

The process ensures traceability from query to visualization through explicit reasoning paths, enabling systematic evaluation of NL2VIS systems' ability to handle ambiguity.

Figure 3: Injecting ambiguities into a seed visualization

Figure 3 demonstrates how we inject ambiguities into a seed visualization through a systematic process: (1) Starting with a seed chart (e.g., a bar chart showing gross by year), (2) Converting it to a seed visualization tree with explicit nodes, (3) Injecting ambiguity nodes (e.g., introducing a choice between Local_Gross and World_Gross), (4) Resolving the tree into multiple valid visualization specifications, and (5) Flattening the trees into concrete visualization queries.

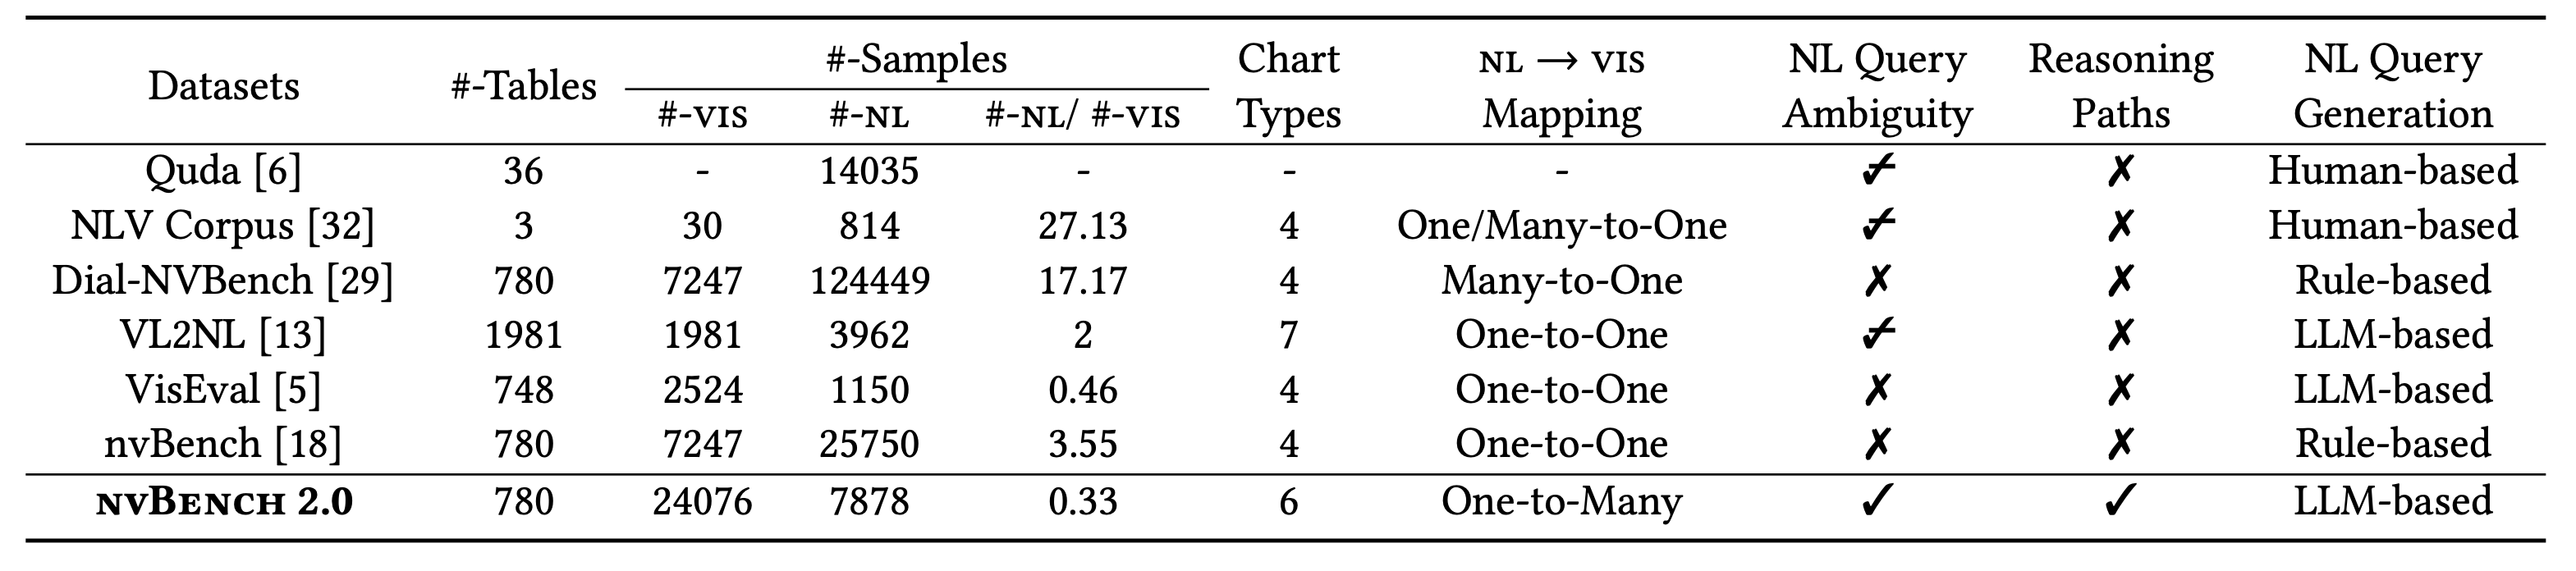
Benchmark Comparison

nvBench 2.0 introduces several key innovations compared to existing NL2VIS benchmarks, particularly its explicit handling of query ambiguity and support for one-to-many mapping between queries and visualizations.

Comparison of NL2VIS benchmarks

Table 1: Comparison of NL2VIS benchmarks.

nvBench 2.0 distinguishes itself from existing benchmarks by: supporting one-to-many mapping from NL queries to visualizations, explicitly modeling query ambiguity, providing reasoning paths to explain ambiguity resolution, and using LLM-based query generation for natural, diverse queries.

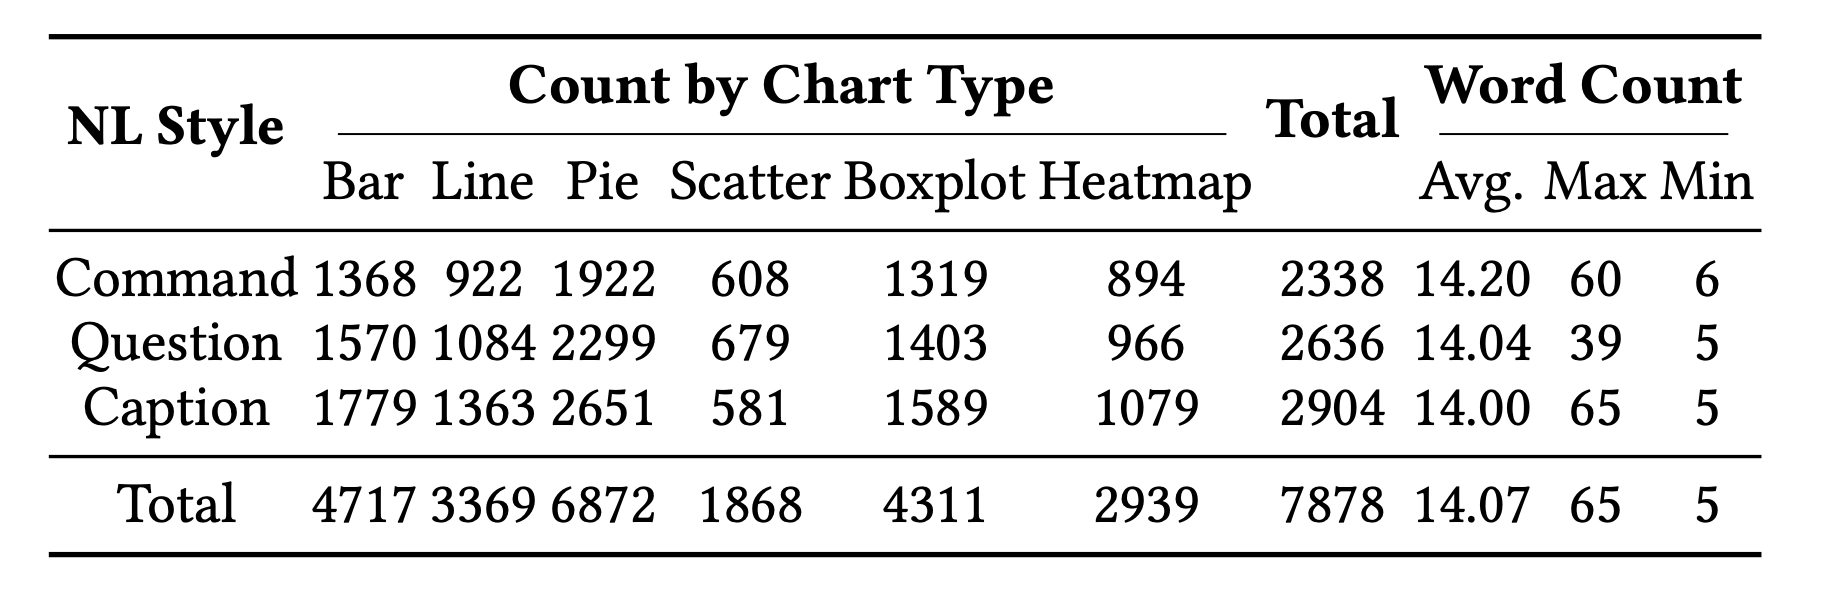
Benchmark Statistics

nvBench 2.0 includes a diverse range of natural language query styles and chart types, ensuring comprehensive coverage for evaluating NL2VIS systems.

Distribution of natural language styles across chart types and word count statistics

Table 3: Distribution of natural language styles across chart types and word count statistics.

The dataset includes diverse query styles (commands, questions, and captions) across various chart types. The average query length is approximately 14 words, with a good balance across all visualization types.

nvBench 2.0 includes detailed statistics on ambiguity types and patterns, providing insights into the distribution and frequency of different ambiguity categories.

Ambiguity count at each reasoning step

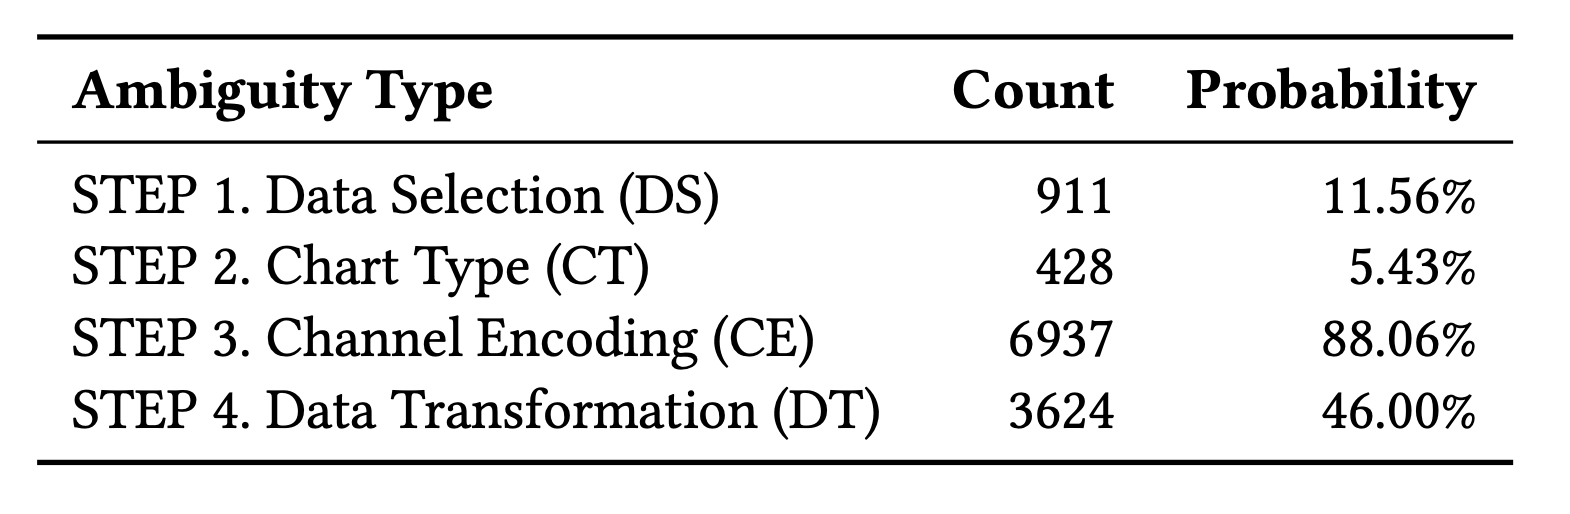
Table 4: Ambiguity count at each reasoning step.

This table shows the distribution of ambiguities across different reasoning steps in the nvBench 2.0 dataset, highlighting which steps in the visualization process are most prone to ambiguity.

Statistics of ambiguity patterns

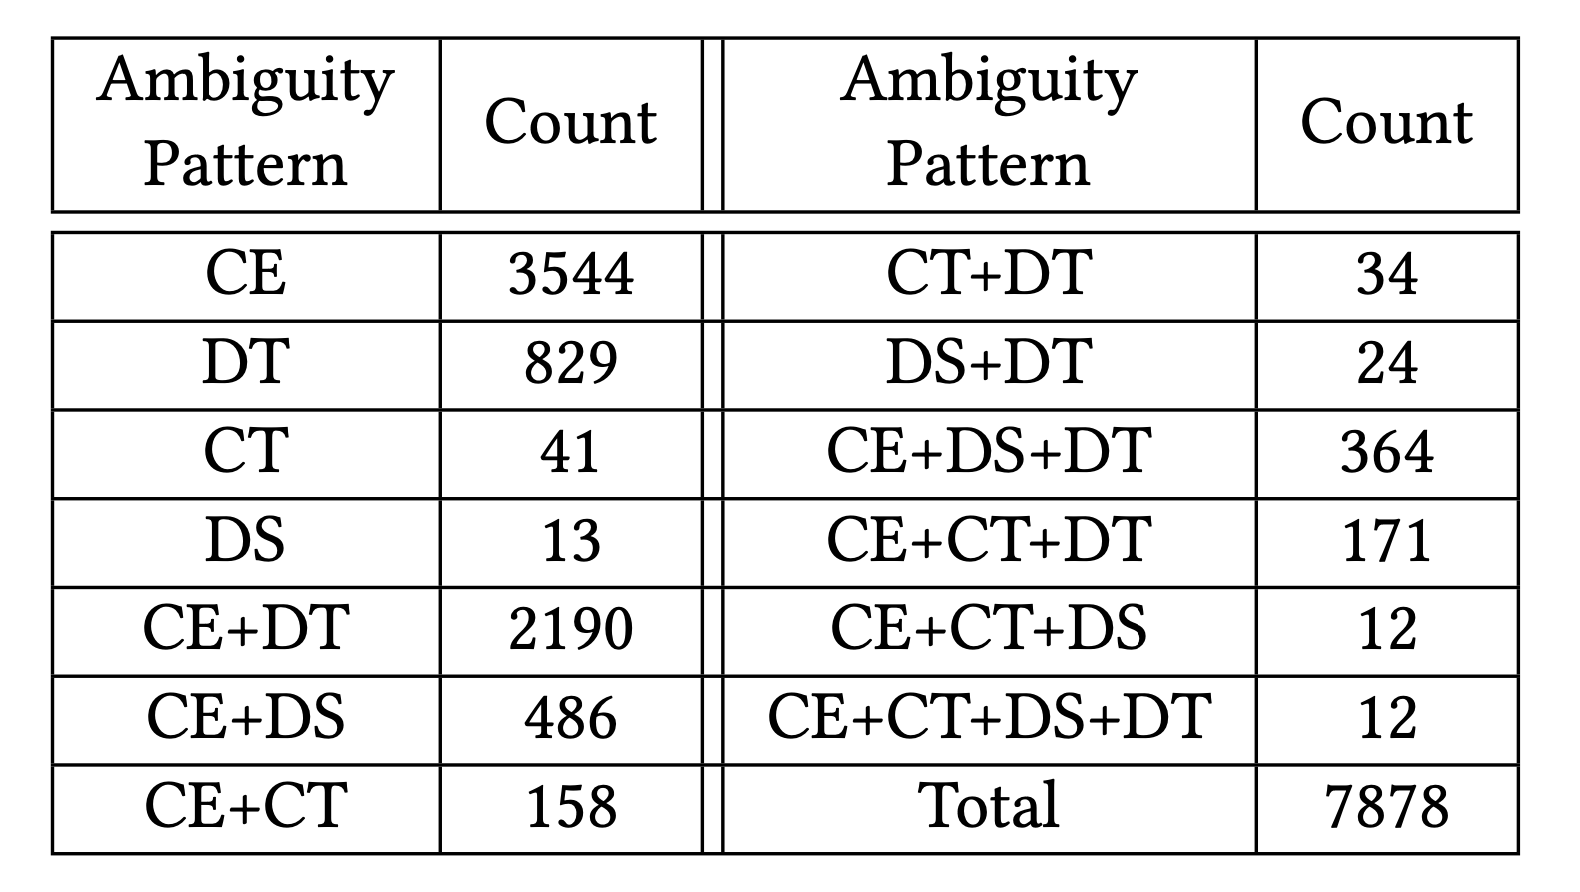
Table 5: Statistics of ambiguity patterns.

Our dataset contains diverse ambiguity patterns, with Channel Encoding (CE) being the most common type of ambiguity (88.06%), followed by Data Transformation (DT) ambiguities (46.00%). Many samples contain multiple types of ambiguity, highlighting the complexity of real-world visualization requests.

Step-NL2VIS for Ambiguous NL2VIS

We propose Step-NL2VIS, an LLM-based model trained on nvBench 2.0, which addresses ambiguity by incorporating a step-wise reasoning process and leveraging preference optimization.

Preference Optimization with Step-DPO

Step-DPO utilizes step-wise paired correct and incorrect samples for preference optimization, delivering rich process supervision signals to the model and fostering improved accuracy at each step.

L(θ) = -E(x,s1~k-1,swin,slose)~Dp[ log σ( β log πθ(swin|x, s1~k-1) / πref(swin|x, s1~k-1) - β log πθ(slose|x, s1~k-1) / πref(slose|x, s1~k-1) ) ]

Where Dp represents a step-wise preference dataset, πθ(·|x, s1~k-1) denotes the policy model to be optimized, πref(·|x, s1~k-1) refers to the reference model, and β controls the divergence between the optimized policy and the reference model.

Experiments

We evaluate the performance of various models on the ambiguous NL2VIS task using nvBench 2.0, comparing our Step-NL2VIS model against state-of-the-art approaches.
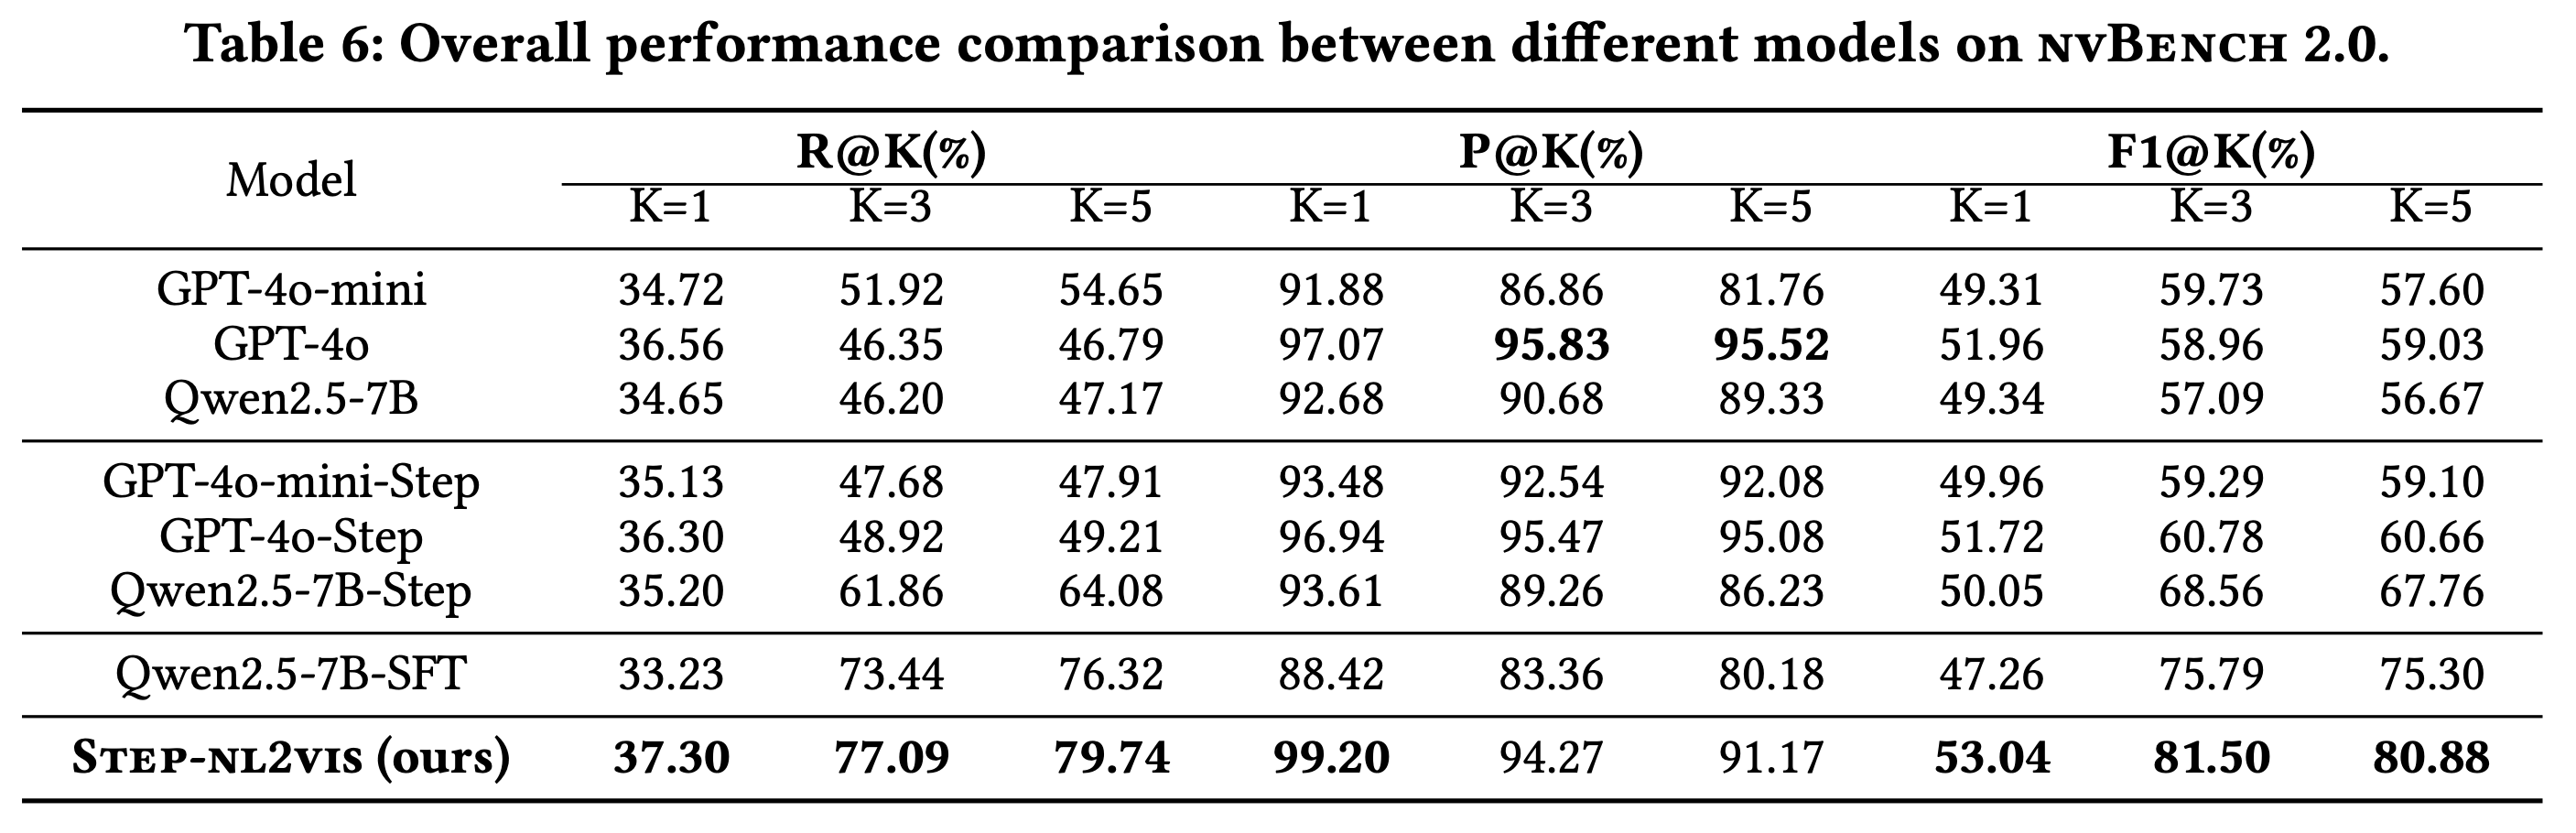
Overall Performance

The table below presents the comprehensive performance evaluation of different models on nvBench 2.0. Our proposed Step-NL2VIS achieves state-of-the-art performance across most metrics.

Overall performance comparison between different models on nvBench 2.0

Table 6: Overall performance comparison between different models on nvBench 2.0.

Our proposed Step-NL2VIS achieves state-of-the-art performance across most metrics, significantly outperforming both prompting-based and fine-tuning-based baselines. Step-NL2VIS obtains the highest F1@3 (81.50%) and F1@5 (80.88%), demonstrating its superior ability to handle ambiguity in NL2VIS tasks.

F1 across different models and ambiguity levels

Figure 7: F1 across different models and ambiguity levels.

The heatmap shows that Step-NL2VIS consistently outperforms other models across most chart types and ambiguity levels. Models incorporating step-wise reasoning generally show better performance than their direct prompting counterparts, confirming the effectiveness of decomposing complex visualization reasoning into explicit steps.

Recall across different models and ambiguity levels

Figure 8: Recall across different models and ambiguity levels.

Step-NL2VIS demonstrates superior recall performance across all ambiguity levels examined. At ambiguity level 3, it achieves 83.3% recall, representing a significant improvement over comparative approaches. The performance advantage of Step-NL2VIS over alternative approaches expands with increasing ambiguity levels.

Citation

If you find nvBench 2.0 useful for your work, please cite:

@article{luo2024nvbench2, author = {Luo, Tianqi and Huang, Chuhan and Shen, Leixian and Li, Boyan and Shen, Shuyu and Zeng, Wei and Tang, Nan and Luo, Yuyu}, title = {nvBench 2.0: A Benchmark for Natural Language to Visualization under Ambiguity}, }

License